Optima Lime — Better Yields — Faster(08) 9241 1155 ↗

OPTIMA LIME / SOIL ACIDITY MANAGEMENT

HiCal

Think beyond
the surface.

See what your application supplies. Explore how incorporation depth changes the treated soil volume, and what the evidence tells us about surface application.

Manufactured lime • Western Australia • HiCal v1.2027

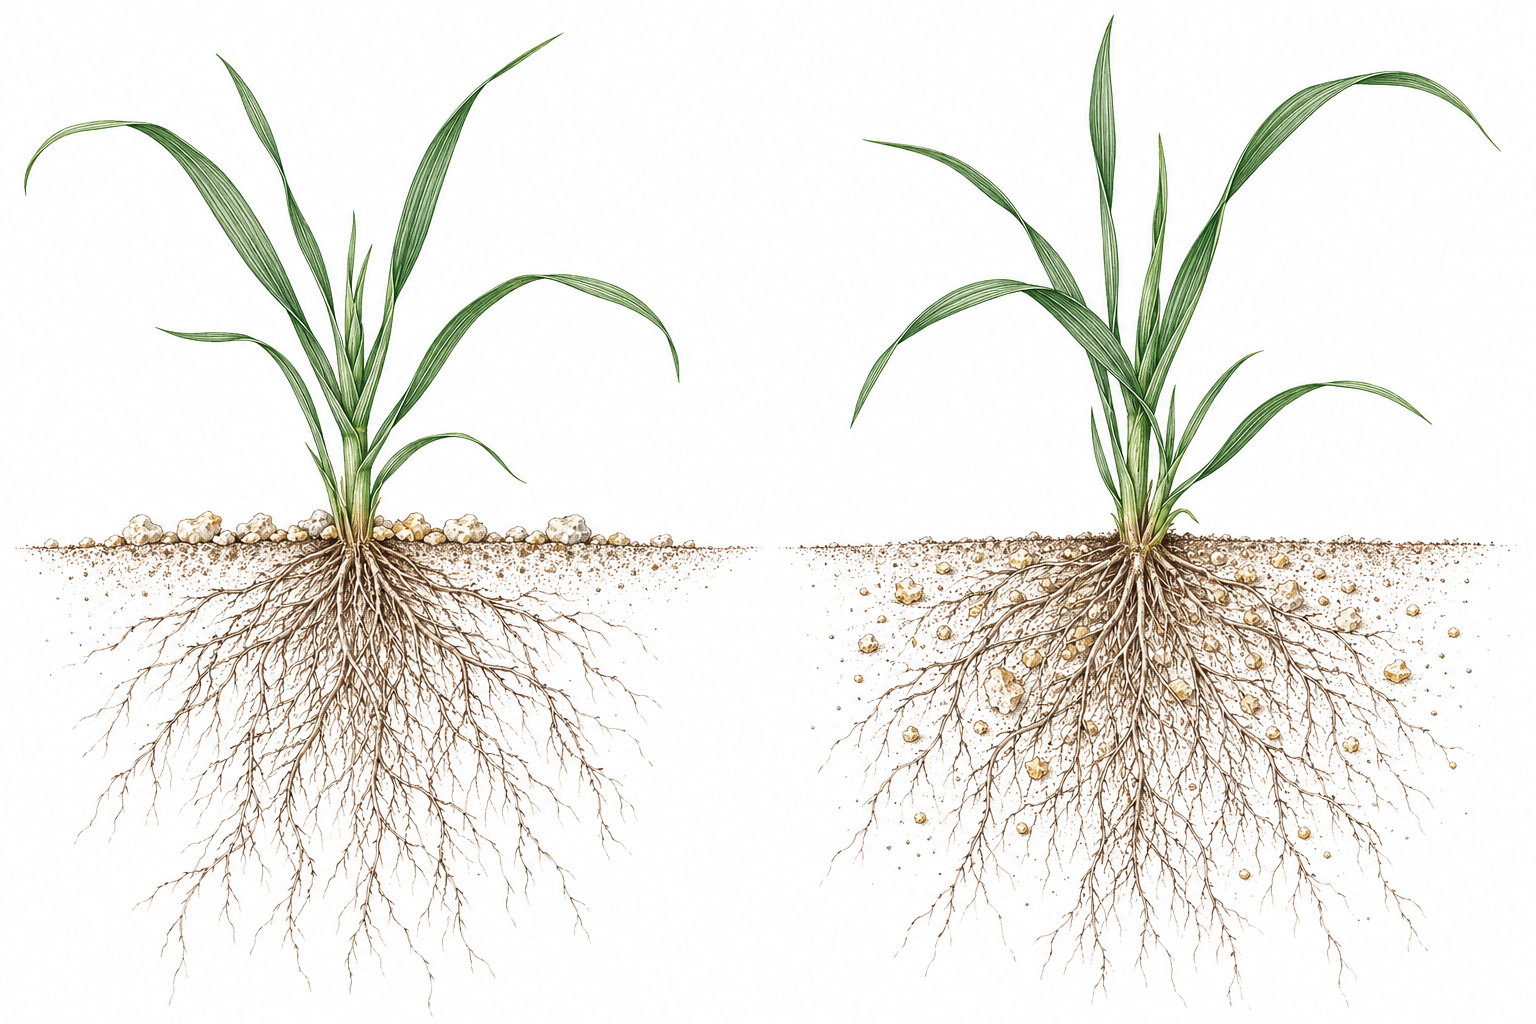
Fine botanical illustration comparing surface-applied HiCal with incorporation through the soil around cereal roots
Surface appliedMaterial placed on the soil surface
IncorporatedMaterial mixed through the treated layer

Illustration of placement only. Root size and illustrated depth do not predict treatment response.

83.7%Bulk neutralising value
33.5%Total calcium
126 kg/tUltrafine particles <0.075 mm
0.85%Available-lime assay · explained below

THE HICAL CONVERSATION / A GUIDED WALKTHROUGH

Look below the surface.
Choose lime for the job.

Understand the soil, compare the particles, then follow the chemistry. Explore the case for HiCal through Johan Potgieter’s Broadcast Liming Update 2024, alongside the newer product specifications and trial evidence.

The HiCal proposition: fine limestone, a distinct available-lime assay and measured soil responses worth assessing where acidity and calcium availability limit the rootzone.

01 / START WITH THE SOIL PROFILE

Where is the constraint?

Texture describes the sand, silt and clay in the soil. Structure describes how those particles form aggregates and connected pores. Compaction can restrict air, water and roots without changing the soil’s texture.

A satisfactory surface pH can sit above an acidic layer. Sample separate depths and identify whether the problem is acidity, compaction, sodicity, salinity or a combination.

The sales conversation

“Let’s identify the depth and chemistry we need to change before choosing the product and rate.”

0–1010–2020–30SurfaceSubsurfaceDeeper layercm
Illustration of sampling layers. Measure each layer with the same laboratory pH method.

Pore size and lime-particle size are different measurements. A fine particle is not guaranteed to pass through a pore or move to a particular depth. Connected flow paths, aggregation, dissolution and soil chemistry all matter. WA soil-acidity guide.

02 / MAKE THE FINE FRACTION VISIBLE

Show the kilograms below 75 microns.

Smaller particles provide more surface area per unit mass for similarly shaped material. That helps explain why fine limestone can react more readily when it contacts moist, acidic soil. The Australian research below connects particle size with early response and residual value.

2024 PRESENTATION EXAMPLE / SLIDES 7–8

161 kg/haHiCal below 75 µm
1 t/ha × 16.1%
40 kg/haBoranup limesand below 75 µm
2 t/ha × 2.0%

The displayed HiCal application supplies about four times as much below-75 µm material in this historical example. That is a difference in fine-material mass, not proof of an equivalent lime rate or four times the field response.

2024 PRESENTATION SNAPSHOT / MASS BELOW 75 µm

ProductBelow 75 µmkg/product tonne
HiCal16.1%161
BioLime14.8%148
Agri-Cal27.7%277
Lancelin limesand0.2%2
Dongara limesand0.2%2
Boranup limesand2.0%20

Slide 7 values, with laboratory dates unconfirmed. The duplicate BioLime supply-format row is shown once. Slide 8 rounds HiCal to 160 kg; the calculation from 16.1% is 161 kg.

Read the date as well as the number.

The newer January 2026 specifications report HiCal at 12.6% and BioLime at 17.6% below 75 µm. Product rankings can change between samples. The 2024 slide figures are kept separate from the certificate-based historical averages and current calculators.

Explore historical specifications · Read the particle-size research

03 / UNDERSTAND WHAT WAS MEASURED

A sieve and a laser describe particles differently.

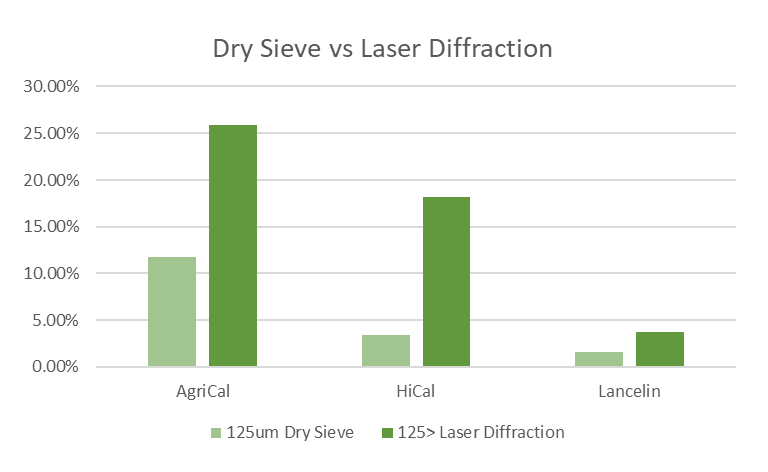
Dry sieving reports the mass passing specified openings. Laser diffraction estimates an equivalent particle-size distribution from light scattering, commonly reported by volume. Dispersion and particle shape can affect the comparison.

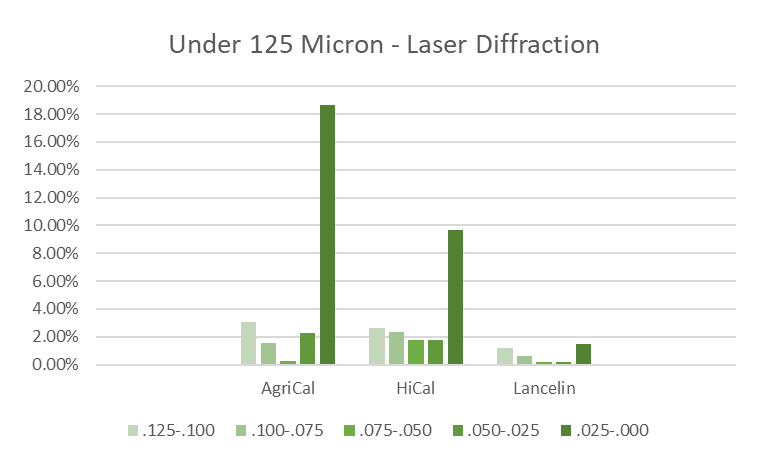
The presentation shows a larger fine fraction by laser diffraction for its HiCal and Agri-Cal samples. It also examines the material below 125 µm in smaller bands. This is a reason to investigate the fine fraction more closely.

The sales conversation

“A single sieve cutoff does not describe everything about the fine material. Let’s compare the same method, sample date and reporting basis.”

Original slide 12 charts. Sample dates, dispersion method, raw results and laser reporting basis are not supplied. The legend in the first chart is ambiguous. These charts are historical illustrations, not inputs to the current particle-size calculator, and they do not quantify movement through soil.

Original 2024 presentation chart comparing dry-sieve and laser-diffraction results for Agri-Cal, HiCal and Lancelin. Laser results are higher in the displayed comparison.
Dry sieve versus laser diffraction, as presented.
Original presentation chart dividing material below 125 microns into five laser-diffraction bands, including below 25 microns.
The fine fraction contains a range of smaller sizes.

04 / CONNECT THE PRODUCT TO SOIL CHEMISTRY

Capacity, test response and exchange chemistry.

HiCal combines crushed limestone with proprietary treatment technology. Its commercial case brings together the limestone fraction, a higher available-lime assay than BioLime and the compared limesands, and observed soil responses.

PRODUCT CAPACITY837 kg CCE/t

HiCal’s January 2026 bulk NV of 83.7% describes its total neutralising capacity.

AVAILABLE-LIME ASSAY0.85% vs 0.19%

HiCal versus BioLime in the January 2026 sheets. On a common method and basis, the higher assay means a greater measured test response.

SOIL RESPONSE TO VERIFYCa + pH by depth

Measure calcium availability and acidity, with exchangeable cations where displacement is the objective.

Release calcium. Dissolution supplies Ca²⁺ to soil solution.

Change exchange occupancy. Calcium can exchange with other cations; the extent depends on the soil and solution chemistry.

Neutralise acidity. Alkalinity consumes acidity. Calcium exchange alone does not establish a pH rise.

Check the outcome. Test pH and exchangeable Ca, Al or Na at matching depths. Displaced sodium still needs drainage and leaching to leave the rootzone.

The sales conversation

“HiCal gives us a reason to assess chemical performance beyond a sieve-only comparison. The value is the measured change in the soil layer we are treating.”

The available-lime assay is not added to CCE and is not a soil reaction-speed multiplier. The presentation’s generic “up to 8 times” statement is not adopted as a verified HiCal field-efficiency claim. Assay interpretation · Exchange chemistry and measurements.

05 / FOLLOW THE FIELD EVIDENCE

Brookton–Pingelly: a response over time.

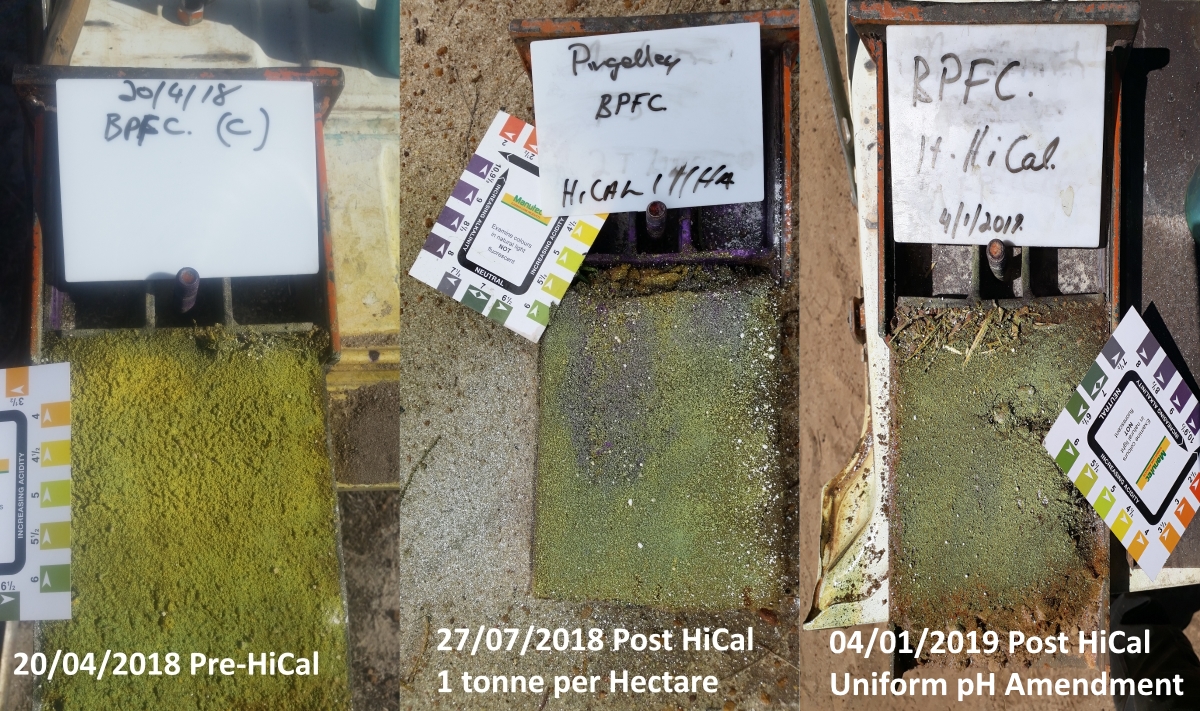
The football-club case study in the 2024 presentation reports surface-applied HiCal and repeat soil testing. It provides a practical example of checking the response rather than judging lime from the stockpile.

  1. April 2018Starting pH 4.3–4.5 in CaCl₂, 0–10 cm. HiCal applied at 1 t/ha.
  2. April 2019A further 1 t/ha HiCal applied. Total reported application: 2 t/ha.
  3. February 2020Reported pH range 4.7–5.7 in CaCl₂, 0–10 cm.
Reported case-study pH (CaCl₂), 0–10 cm
Sampling siteStartFinishChange
Site C4.55.7+1.2
Site E4.34.7+0.4

Different pH changes call for a buffering assessment.

pH measures hydrogen-ion activity. It does not quantify all the reserve acidity that lime must neutralise. These results cannot establish equal acid removal or an exact extra tonne required at Site E.

Before/after case study, not a controlled product comparison. Untreated controls, replication and statistical testing are not provided. Soil-test values are reported for 0–10 cm and do not establish a treatment depth below that layer.

Three soil-profile photographs from the supplied Brookton–Pingelly presentation, labelled April 2018 before HiCal, July 2018 after application and January 2019 after application.
Original slide 15 photographs. Colour indicators illustrate the profile; they do not replace quantitative laboratory testing. The January 2019 photograph predates the second reported application.
Separate evidence at depth: Dumbleyung 2025

The existing trial summary reports available Ca of 18 to 33 mg/kg and water pH of 6.52 to 6.85 at 20–25 cm for untreated versus 2 t/ha HiCal. This is a separate trial with a different pH method. Placement, timing and statistical significance remain unconfirmed in the supplied brochure.

Explore the Dumbleyung measurements

06 / TURN THE EVIDENCE INTO A LIME DECISION

Match the product to the soil and the job.

Compare the cost of achieving a defined chemical target at the required depth and time. Start with current specifications, the soil profile, intended placement and a delivered quote.

Compare limesand and crushed-limestone options.

Use current NV/CCE, particle distribution, lime requirement and delivered/applied cost. Incorporation can improve contact with the acidic layer. HiCal’s treatment premium should be assessed against a measurable chemical benefit.

What supports the HiCal conversation?

  • More below-75 µm material than the three limesands in the current comparison.
  • A higher reported available-lime assay than BioLime and those limesands.
  • Case-study pH changes and a separate trial recording available-Ca and pH differences at depth.

What defines value for your paddock?

  • Starting and target pH, sampling depth and laboratory lime requirement.
  • Placement, moisture, time and the measured calcium or exchange response.
  • Current product, freight and application prices for the required rate.

“Choose the liming option that delivers the required soil-chemical change at the lowest justified applied cost. Use the whole soil profile and the evidence to make that decision.”

Decision support, not a product prescription. Salinity is not corrected simply by adding lime. Sodium management requires a suitable calcium source and drainage; acidity and aluminium require separate diagnosis. The 2024 deck’s prices and blanket depth/speed claims are not treated as current quotes or guarantees.

Sources and how this walkthrough uses them

Presentation: Johan Potgieter, Broadcast Liming Update 2024, supplied as “LimeUpdate.Lime Tech explained.pptx”. Soil context: slides 4–6; historical product table and mass example: slides 7–8; measurement charts: slide 12; Brookton–Pingelly case study: slides 14–16; product selection: slides 17–19. Only the selected measurement charts and case-study photograph are reproduced here.

The deck is historical context. Its below-50 µm remarks are not substituted for the below-75 µm product data. Historical charts are not merged with current certificates, laser estimates are not treated as sieve mass percentages, and the supplied pH-to-ion calculation is not used to infer total soil acidity.

NSW DPIRD: neutralising value, fineness and applied cost · DPIRD: soil acidity, a guide for WA farmers and consultants · Conyers, Scott & Whitten: particle-size research · Current product specifications.

LEAD RESEARCH / SOUTHERN NSW / 2020

Fine particles.
Early response.
Lasting value.

Conyers, Scott & Whitten · Crop & Pasture Science 71, 368–378

The reaction rate and residual value of particle size fractions of limestone in southern New South Wales

Read the published research ↗

EARLY RESPONSE

Below 75 µm matters

The finest fractions, especially below 75 µm, produced the greatest initial soil-pH increase per tonne.

SUBSURFACE CHEMISTRY

Calcium and alkalinity

Finer particles improved movement of calcium and alkalinity beneath the 0–10 cm incorporation layer.

RESIDUAL VALUE

Benefit persisted

Fine material retained surface-pH benefits at seven years. Most fractions approached similar surface pH around year six; 2–5 mm particles lagged.

Reported dissolution took up to three years at 2.5 t/ha and six years at 5 t/ha. These are study conditions, not a timetable for HiCal.

WHY THIS BELONGS IN THE HICAL COMPARISON

Compare ultrafines separately.

The calculator’s broad below-500 µm grouping cannot distinguish the below-75 µm fraction. Use the measured ultrafine mass alongside total capacity and soil-response evidence.

HiCal has more ultrafines than the three limesands shown; BioLime has more than HiCal. Product assays are separate from the research.

Material below 75 µm · kg per product tonne
HiCal126 kg/t
BioLime176 kg/t
Dongara limesand9 kg/t
Lancelin limesand6 kg/t
Boranup limesand9 kg/t

All bars start at zero; common scale 0–200 kg/t. Product specifications, not trial reaction measurements.

Keep the evidence connected

This study supports the relevance of fine limestone to subsurface chemistry. The separate HiCal trial records available-Ca and pH changes at 20–25 cm. Neither establishes a HiCal-versus-limesand displacement or reaction-speed multiplier.

Summary based on the publicly accessible abstract; full numerical curves were not available. No reconstructed response curves or new effectiveness factors are used. The study does not test HiCal or its proprietary treatment, nor establish a universal surface-applied movement depth.

01 / APPLICATION & SOIL VOLUME

Same tonnes.
Different soil volume.

Following the MacroPrima planning principle: define the treated zone, calculate soil mass, then compare the material supplied. HiCal is calculated in tonnes and neutralising capacity.

Bulk density starts at an editable assumption of 1.4. Texture is recorded for interpretation; it does not apply an unverified reaction multiplier. Full-width application, uniform allocation within each selected layer.

Optional laboratory lime requirement

Enter a laboratory or adviser-assessed requirement as pure CaCO₃ equivalent for the selected soil layer. This converts capacity to product tonnes; it does not derive a requirement from pH alone.

YOUR HICAL APPLICATION

100tonnes for your paddock
Neutralising capacity—CaCO₃ equivalent / ha
Total calcium supplied—kg Ca / ha, not soluble Ca
Selected soil mass—tonnes soil / ha
Potential Ca loading—mg/kg, all total Ca allocated
Quoted costEnter pricesProduct + freight + application
Ultrafines supplied—kg / ha below 0.075 mm

Capacity and mass balance only. Calcium loading is not a prediction of exchangeable Ca, base saturation, soil pH or sodium/aluminium removal.

What changes with depth?

Compare your selected incorporation and surface-layer scenarios at the same rate.

Both bars assume the entire dose is uniformly allocated to the stated layer. The surface bar is a hypothetical concentration comparison, not evidence that lime has moved or reacted through that depth.

Show the calculation

Soil volume = 10,000 m² × depth (cm) ÷ 100. Soil mass (t/ha) = volume × bulk density. CaCO₃ equivalent = HiCal t/ha × 0.837. Total Ca = HiCal t/ha × 335 kg/t. Potential Ca loading (mg/kg) = total Ca kg/ha × 1,000 ÷ soil mass t/ha. Ultrafines = HiCal t/ha × 126 kg/t. Capacity-equivalent product rate = laboratory CaCO₃-equivalent requirement ÷ 0.837.

These equations assume the brochure analysis applies to the delivered material. Reaction completeness, timing, loss, stratification and imperfect mixing are not modelled in this soil-volume calculator. Compare particle-size estimates separately in the limesand and freight section.

02 / PLACEMENT & DEPTH

How deep
does it work?

Incorporation depth is a management input. Surface response depth is an outcome to measure.

Selected mixing / assumed response layerDumbleyung sampled depth, 20–25 cm

Profile to 60 cm. Diagram shows the chosen scenario, not a reaction front.

01

When incorporated

Mixing brings lime into contact with soil at the chosen depth. At a fixed rate, doubling depth doubles the soil mass and halves the average material loading. Actual distribution depends on the implement and mixing quality.

02

When left on the surface

Reaction and downward effects depend on moisture, acidity, buffering, particle size and time. There is no validated HiCal depth-per-year equation in the supplied brochure. The adjustable surface layer above is an assumption you can compare with soil testing.

03

What was measured at depth?

The supplied Dumbleyung means include higher water pH and available calcium at 20–25 cm at 2 t/ha. Application placement, elapsed time and statistical significance are not confirmed in the brochure. This is evidence of a sampled response, not proof of a universal 25 cm surface-treatment depth.

Independent research context

WA research on conventional lime found slow subsurface improvement from surface application and faster correction when lime was incorporated. These findings explain the placement principle; they do not calibrate a HiCal movement rate. Azam & Gazey, 2020 ↗

03 / DUMBLEYUNG 2025

See the measured
response.

Control included. Four application rates, with topsoil at 0–5 cm and subsoil at 20–25 cm. Descriptive means reproduced from the HiCal brochure.

2 t/ha VS CONTROL / 20–25 cm

+0.33water pH units+83.3%available soil calcium

These are observed treatment differences, not outputs of the calculator.

Dumbleyung treatment means • source: HiCal v1.2027, page 3
Rate t/hapH water
0–5 cm
pH water
20–25 cm
Ca mg/kg
0–5 cm
Ca mg/kg
20–25 cm
HLW change %Protein %Screenings %
0 / Control6.566.5217180.09.075.96
0.56.386.582321+3.57.752.02
16.686.762824+4.98.614.57
26.856.853733+5.07.762.36

15 plots in three blocks: control n=4, 0.5 t/ha n=3, 1 and 2 t/ha n=4 each. Raw plot data and significance tests were not supplied. Soil method as reported: “2:1 saturated paste extract”; water pH is not interchangeable with CaCl₂ pH. HLW is shown as change only because the original test volume was unconfirmed. No trial yield data are reported here.

04 / PRODUCT SPECIFICATION

Reactivity and capacity.
Read them together.

HiCal combines crushed limestone with proprietary treatment technology. The brochure positions the blend for an earlier pH response where tillage is limited.

Ultrafine fraction

126 kg below 0.075 mm in each tonne of HiCal. Particle fineness supports contact and reaction, but is only one part of performance.

Neutralising capacity

One tonne supplies 0.837 tonnes of theoretical CaCO₃-equivalent capacity. A high product pH alone does not establish field speed or a lower equivalent application rate.

Placement matters

The same dose spread through more soil supplies less material per kilogram. Match rate, mixing and the soil-test layer to the acidity you need to address.

Brochure comparison • January 2026 HiCal/Bio-Lime samples; December 2025 others
Product / sourceBulk NV %pH CaCl₂Available lime %Total Ca %<0.5 mm %
HiCal / Wanneroo83.712.40.8533.564.4
Bio-Lime / Wanneroo82.69.30.1933.080.7
Agri-Cal / Dongara92.510.82.0337.098.5
Limesand / Boranup89.88.50.0935.989.4
Limesand / Dongara90.58.40.1636.297.9
Limesand / Lancelin95.38.50.2538.196.1

HiCal analysis: 21 January 2026, NW26-0039. Dongara sizing corrected from analysis NW25-00948-S02, 3 December 2025. Available lime is a separate assay, not soluble calcium. These specifications do not establish 1:3 field equivalence.

PRODUCT SPECIFICATIONS / HISTORICAL AVERAGES

Average specification.
Product by product.
Size by size.

Historical certificates plus the 2025/2026 specifications already on this site. Each laboratory sample counts once. Compare average particle mass, fraction NV and the CCE contribution of each size.

Download source data JSON ↓
How these averages are calculated

Samples are equally weighted, not weighted by production volume. Mean mass % = sum of each sample’s fraction mass % ÷ sample count; kg/t = mean mass % × 10. Within a sample, adjacent fractions are combined only when they exactly cover the requested interval. No interpolation across 75, 125 or 150 µm boundaries is used.

For samples with complete NV data in an interval, fraction NV = sum(mass % × NV %) ÷ sum(mass %), across those samples. This is the mass-weighted NV of an equal-product-mass composite, not the arithmetic mean of the NV percentages. Mean CCE contribution = mean(mass % × NV % ÷ 10), in kg CCE per product tonne, using the same complete samples. The separate mass and NV/CCE counts identify missing evidence. Missing or insufficient NV is never entered as zero; a measured zero-mass fraction contributes zero CCE.

Common fractions are below 250, 250–500, 500–1,000 and above 1,000 µm. Detailed fractions use only compatible boundaries; counts can therefore vary between rows and detailed rows must not be summed as a single complete average specification. Above 1,000 µm can combine 1–2 mm and above 2 mm only for mass when the latter NV is missing.

These are historical descriptive averages, not a specification guarantee for the next delivery. Screening, sampling and laboratory methods may differ. Original mass totals, including rounding to 99.9% or 100.1%, are retained without normalisation. Bulk NV is averaged independently of fraction NV; the two need not reconcile. Calcium is not reported by size and is not inferred from NV.

Sample register, duplicate handling and source issues

The three December 2021 limesand COP files carry the same laboratory IDs and dates as their detailed versions. They are not additional independent samples. The detailed 75/150 µm versions are used; COP versions are excluded from all means. They have differing fraction values; Dongara also reports bulk NV 93.1% in COP versus 93.2% in the detailed version. This is a documented selection, not a resolved laboratory correction.

Wanneroo is identified from the product source and Wesco Road address: its 2021 sheets contain a conflicting “Dongara” pit-name entry. The Boranup and Dongara detailed sheets contain a “Premium Lancelin” description; source, address and laboratory ID identify them. The Moylan HiCal sheet’s header says January 2015, but its analysis date is 1 December 2015; the analysis date is used. Moylan/Wattleup products remain separate from Wanneroo. Boranup years are grouped by source, although screen sizes differ.

The existing corrected Dongara December 2025 75–150 µm mass of 12.0% is retained. The public sheet contains a typographical 312.0%. The older available-lime assays explicitly name AS4489.6.1; this does not establish the method or reporting basis of the 2025/2026 assays.

Basis on this page: this section reports historical means. The application/freight calculators and dated sales comparisons continue to use the individual 2025/2026 certificates, not these historical averages.

AVAILABLE LIME / THE CHEMICAL DISTINCTION

Higher available lime.
A reason to look
beyond particle size.

HiCal reports 0.85% available lime: 4.47 times BioLime and 3.40–9.44 times the three limesands below. This is a measured product distinction relevant to the reactivity discussion; its field significance must be assessed alongside neutralising capacity, particle size and soil response.

WHAT THE ASSAY MEANS

A defined laboratory reaction

Common available-lime methods use a rapid sugar extraction and acid titration to measure the constituents that react under specified test conditions. The result describes that test-reactive fraction, rather than all the limestone in the product.

WHY A HIGHER RESULT MATTERS

More measured test response

On the same method and reporting basis, a higher result means more available-lime equivalent detected per unit of product. It supports investigating an early chemical response that a sieve-only comparison cannot describe. It does not measure reaction speed in soil.

READ WITH NV / CCE

Capacity and availability

NV/CCE describes total acid-neutralising capacity; available lime characterises a different analytical response. HiCal’s 0.85% does not mean only 0.85% can ever react. Its bulk NV remains 83.7%, and the available-lime result is not added to it.

Reported available-lime assays • ratios compare assay values, not field efficiency
ProductAvailable limeHiCal / product
HiCal0.85%1.00×
BioLime0.19%4.47×
Dongara limesand0.16%5.31×
Lancelin limesand0.25%3.40×
Boranup limesand0.09%9.44×
Agri-Cal2.03%0.42×

HiCal is higher than BioLime and these three limesands, but not Agri-Cal. Values are from the product specifications shown above, with different sampling dates. The HiCal sheet does not identify the available-lime test method, equivalent reporting basis or dry/as-received basis; the sieve-method reference does not resolve this. Confirm these details with the laboratory before converting the result to a chemical mass or interpreting cross-product differences quantitatively.

THE HICAL CASE

Assess the chemistry that reaches the rootzone.

“HiCal combines a higher available-lime assay than BioLime and the compared limesands with measured calcium and pH responses in the subsoil trial. Together, these provide a reason to assess its chemical performance beyond bulk NV or a single sieve cutoff. The value to verify is the change in acidity and calcium availability at the depth that matters.”

Connect the assay to the soil response

The product assay and soil available-calcium test measure different things. At Dumbleyung, 2 t/ha HiCal was associated with available Ca increasing from 18 to 33 ppm and water pH from 6.52 to 6.85 at 20–25 cm versus untreated plots. These observations support a soil-response case, but do not isolate which product component caused it.

Calcium entering solution can change exchange-site occupancy. Alkalinity neutralises acidity; calcium exchange alone does not raise pH. Confirm changes in exchangeable Ca, Al, Mg, K and Na with matched tests, rather than inferring them from extractable Ca alone.

Follow the calcium and the exchange chemistry →

Measure chemical value per dollar

Compare delivered and applied cost for a defined chemical target, depth and time: for example, a target pH together with lower exchangeable acidity or Al. Include calcium and other exchangeable cations where relevant.

The available-lime ratio cannot establish a lower application rate or a financial return. A matched trial at equal product rates and equal CCE doses would show whether HiCal achieves the target sooner or at lower total cost.

Assay sources and interpretation

ASTM C25 lists Available Lime Index and Calcium Carbonate Equivalent as separate determinations. Cheney Lime’s testing guidance describes rapid sugar extraction and titration. These explain common methods; neither establishes which method was used for these product certificates.

Product source: HiCal January 2026 specification and the comparative specifications linked in the sections below. Assay ratios are not multipliers for reaction speed, movement depth, cation displacement or soil-pH change.

SITES C & E / UNDERSTANDING THE PH RESPONSE

Different pH responses.
Understand the buffer.

The Brookton–Pingelly case study reports a larger pH rise at Site C than Site E after two annual HiCal applications of 1 t/ha. The complete 2024 presentation identifies the test as CaCl₂ pH at 0–10 cm, from April 2018 to February 2020. These pH values alone do not identify the cause of the different responses. Explore the full case-study walkthrough.

Brookton–Pingelly case study • pH CaCl₂, 0–10 cm • April 2018 to February 2020 • 1 t/ha in April 2018 and April 2019
SiteStarting pHFinal pHChange
C4.55.7+1.2
E4.34.7+0.4

pH is an intensity measure

pH describes hydrogen-ion activity. Converting pH into an estimated number of solution H⁺ ions does not measure the soil’s total acidity or the total acid neutralised by lime.

Buffering controls the demand

Exchangeable and reserve acidity can replenish solution acidity as lime reacts. Clay, organic matter and aluminium chemistry influence the lime needed for a given pH change. A smaller rise can reflect greater buffering, but these two pH pairs do not prove that explanation.

Set the rate from the soil

Use a laboratory lime-requirement or buffering assessment with target pH, soil mass and depth, then account for product NV and reaction conditions. These slides cannot establish equal acid removal or that Site E needs exactly one additional tonne.

Soil buffering is a property of the soil; it is not calculated from the product’s available-lime percentage. Source for buffering and lime-response principles: WA Soilguide, chemical factors affecting plant growth. No buffer index or acid-neutralisation mass has been assigned to either site.

HICAL / BIOLIME

Calcium supply.
Rootzone chemistry.

BioLime supplies untreated crushed limestone. HiCal combines crushed limestone with proprietary treatment technology. Compare their chemical profiles alongside the measured HiCal response at depth.

THE SALES CONVERSATION / HICAL VS BIOLIME

Put the focus on the chemistry where roots grow.

“BioLime provides calcium and neutralising capacity through crushed limestone. HiCal offers a different chemical profile: a higher available-lime assay, slightly greater total neutralising capacity and observed subsoil calcium and pH responses. When the objective is to change rootzone chemistry, assess those responses alongside particle size and delivered cost.”

TOTAL NEUTRALISING CAPACITY

837 vs 826 kg CCE/t

HiCal supplies 11 kg more CaCO₃-equivalent capacity per tonne. NV and CCE express the same capacity basis here; do not add them together.

CALCIUM SUPPLIED

335 vs 330 kg Ca/t

Total calcium supplied is distinct from calcium dissolved, calcium recovered by a soil extraction and calcium occupying exchange sites.

Finished-product assays · 21 January 2026 · quantities per tonne
Measured propertyHiCalBioLime
Bulk NV / CCE83.7% · 837 kg CCE/t82.6% · 826 kg CCE/t
Total calcium33.5% · 335 kg/t33.0% · 330 kg/t
Product pH (CaCl₂)12.49.3
Available lime · reported assay0.85%0.19%
Material below 75 µm126 kg/t176 kg/t
CCE contained below 75 µm118.2 kg/t170.2 kg/t
Material below 500 µm644 kg/t807 kg/t
CCE contained below 500 µm545.1 kg/t683.5 kg/t

BioLime has more fine material in these samples; HiCal has higher reported available lime and product pH. The HiCal trial below adds measured soil-response evidence, but is not a head-to-head BioLime comparison.

Particle distribution and interpretation
Mass kg/t and fraction NV% · wash-sieve measurements
SizeHiCal kg/tHiCal NV%BioLime kg/tBioLime NV%
<75 µm12693.817696.7
75–150 µm7971.210465.4
150–250 µm20180.927478.3
250–500 µm23887.425391.2
500–1,000 µm9886.16684.3
1–2 mm8488.54486.6
>2 mm174Not reported83Not reported

Fraction CCE kg/t = fraction mass kg/t × fraction NV ÷ 100. Fraction assays and bulk assays are separate measurements and do not reconcile exactly. Calcium by size fraction is not reported. Fine material is not the same as material already reacted.

Product pH is not a prediction of soil pH response or reaction speed. Available lime is a separate reported assay. These samples are not a controlled before-and-after treatment pair. Reaction speed and rootzone movement require matched field or incubation evidence; no pH multiplier is applied.

HiCal technical sheet · BioLime technical sheet. Published assays dated 21 January 2026.

HICAL / DONGARA / LANCELIN / BORANUP

More ultrafines.
A different chemical profile.

HiCal has substantially more material below 75 µm and a higher available-lime assay than these three limesands. The limesands have greater total neutralising capacity per tonne.

THE SALES CONVERSATION / HICAL VS LIMESAND

Compare chemical response alongside tonnes delivered.

“HiCal delivers 126 kg of ultrafine material per tonne, compared with 6–9 kg in these limesands, together with a higher reported available-lime assay. Its subsoil trial recorded increased available calcium and pH at 20–25 cm. That makes HiCal worth assessing where calcium availability and acidity at depth are the target—using measured soil chemistry to confirm the response.”

Published product assays · quantities per tonne · available-lime ratios calculated against each limesand
ComparisonHiCalDongara limesandLancelin limesandBoranup limesand
Material below 75 µm · kg/t126969
Available-lime assay · %0.850.160.250.09
HiCal ÷ this product’s available-lime assay1.00×5.31×3.40×9.44×
Total NV/CCE · %83.790.595.389.8
Total neutralising capacity · kg CCE/t837905953898
Total calcium · kg/t335362381359
Product pH · CaCl₂12.48.48.58.5

Ultrafine mass and available-lime assay ratios are not speed, soil-pH, displacement or depth multipliers. Available lime is not added to bulk CCE. HiCal also has a larger coarse fraction; an early-response comparison must consider the complete distribution and chemistry. These three limesands are the comparison group here; Agri-Cal reports a higher available-lime assay than HiCal.

Specifications: HiCal · Dongara · Lancelin · Boranup. The transport calculator retains the corrected Dongara sieve value.

MEASURED RESPONSE / CHEMICAL INTERPRETATION

Follow the calcium.
Measure the exchange.

Assess calcium supply, exchange-site occupancy and acidity neutralisation together. Changing the cations held on the soil is distinct from changing the soil’s exchange capacity.

DUMBLEYUNG · 20–25 CM

18 → 33 ppm Ca

Reported available calcium: untreated versus HiCal 2 t/ha. An increase of 15 ppm, or 83.3%, in the measured extract.

SAME SAMPLED DEPTH

6.52 → 6.85 pH

Water pH increased by 0.33 units versus untreated. This is an observed trial difference, not a calculator prediction or CaCl₂ pH.

WHAT THIS ESTABLISHES

A soil chemical response

Higher measured available Ca and pH occurred with HiCal. Neither measurement identifies displaced cations or proves superiority over BioLime or limesand.

Source: HiCal v1.2027 brochure, Dumbleyung trial means. Placement, elapsed time and statistical significance are not confirmed in the supplied brochure. Available-Ca extraction is not established as exchangeable Ca. Control water pH was 6.52: this trial does not itself demonstrate correction of Al toxicity. See all rates and reported trial details →

The chemistry to explain—and the measurements that verify it
StepChemical mechanismEvidence to measure
1 · Release calciumDissolution makes Ca²⁺ available in soil solution. Total Ca supplied is not the same as dissolved or exchangeable Ca.Solution Ca and method-defined extractable Ca by depth and time.
2 · Change exchange occupancyCa²⁺ can replace other cations on exchange sites. The extent depends on concentrations, charge and soil selectivity; replacing Mg or K is not automatically desirable.Exchangeable Ca, Mg, K, Na and Al; CEC/ECEC and saturation percentages using consistent methods.
3 · Neutralise acidityThe product’s alkalinity consumes acidity. Calcium exchange alone does not neutralise acidity. As acidity is corrected, soluble and exchangeable Al can decline through precipitation and other equilibria.pH, exchangeable acidity and Al, plus soil buffering or lime requirement.
4 · Remove displaced sodium where relevantExchange moves Na into solution; drainage and leaching are needed to remove it from the rootzone. Displacement is not removal from the soil.Exchangeable sodium percentage, solution Na, EC and drainage conditions.
5 · Check nutrient availabilityChanges in pH and ion equilibria alter nutrient solubility and retention. The direction depends on the starting soil: higher pH is not universally better for every nutrient.Matched nutrient tests, pH and cation measurements before and after, at the same depths.
Sales-team takeaway

“The target is a measured change in rootzone chemistry: more useful calcium availability, appropriate exchange-site occupancy and reduced acidity where it is a constraint. HiCal’s assays and trial response justify evaluating that chemical performance. Confirm Al or Na displacement with the relevant soil tests.”

General mechanisms: NC State: acidity, exchange and liming · Iowa State: calcium–sodium exchange and leaching. These explain soil chemistry; they do not quantify HiCal-specific treatment effects.

Compare delivered chemistry and cost →

05 / LIME & FREIGHT COMPARISON

Your town. Your truck.
Your lime cost per hectare.

Choose a product and truck for each option. Compare calcium, neutralising capacity, fine material delivered and the total applied cost.

Road zoning → network corridor kilometresSelect the truck’s actual Tandem Drive RAV network (2–10), then calculate kilometres. The estimate follows Main Roads road segments listed on that network, ending at the nearest connected network road to the town centre. Conditional roads are flagged. Published Optima Lime pit pins are snapped to their public access roads; turn restrictions, bridge limits, closures and private access still need carrier review. View official network conditions ↗

See kilograms of this fraction per product tonne, its CCE contribution and your applied cost per tonne of that fraction.

Six bulk products are available in every product dropdown. To compare two trucks on the same run, select the same product twice. All prices are A$ excluding GST; blank prices are unknown, not zero.

Compare what reaches each hectare

How reactivity, fine material and costs are calculated

Smaller fraction efficiency: cumulative fraction kg per product tonne = 10 × the sum of sieve percentages below the selected size. Its CCE kg/t is the sum of each fraction’s mass × its own measured NV. If any required fraction NV is unreported, the combined CCE is not estimated from bulk NV. Applied A$/tonne of selected material = applied A$/product tonne ÷ selected fraction mass proportion. Cost per tonne of its CCE uses that fraction’s measured CCE contribution. These are component-cost comparisons, not proof of equal field efficacy.

Below 75 µm: product t/ha × 1,000 × the measured percentage below 0.075 mm. This is the amount of ultrafine material applied, not a claim that all of it has reacted. Its CCE kg/ha uses the measured NV of that specific fraction. Lancelin has no published NV for this fraction, so its ultrafine CCE is shown as unavailable.

Conventional particle-size index: the particle-size factor weights material below 0.5 mm at 100%, 0.5–1 mm at 50%, and above 1 mm at 20%, normalised for rounded sieve totals. Size-adjusted CCE kg/ha = product t/ha × 1,000 × bulk CCE fraction × size factor. This is a conventional carbonate size index, not measured reaction over time. It does not model the proprietary treatment; HiCal’s size-adjusted CCE and associated cost are therefore not reported. Soil acidity, moisture, placement and chemistry also affect reaction.

CCE and NV: the supplied bulk NV expresses calcium carbonate equivalent as a percentage of pure CaCO₃. They are the same capacity measure here, not separate multipliers. Total Ca is elemental calcium.

Costs: whole loads = area × product rate ÷ payload, rounded up. Freight cost = loads × [(pit-to-town km + farm-leg km) × charged legs × A$/vehicle-km + fixed cost/load]. Divide by product tonnes for freight A$/t. A carrier quote replaces this calculation. Total A$/ha = rate × (product price + freight + spreading A$/t) + incorporation A$/ha. No truck payload or charge is assumed from truck type.

Routes: the local shortest-path calculation uses Main Roads road-node connectivity, road-segment true distances and SLK intervals split at zoning boundaries within the selected Tandem Drive Network 2–10. Roads outside that network are excluded. The town endpoint is the nearest connected listed road within 1.5 km of the geocoded town centre. This last offset is displayed and excluded; it is not an assumed legal road connection. Conditional network segments may be used and are flagged for review. This bidirectional corridor model does not resolve turning or one-way restrictions, bridges, closures, permits or private access. It is not a navigation route or an approval. It covers the downloaded network snapshot, not live changes. Road records without connection-node identifiers are omitted, so a missing connection may yield a detour or no result; the estimate is not a verified shortest legal driving route. General-access / Network 1, tri-drive, AMMS and PBS schemes are not modelled; use a carrier quote for these. The access checkbox records your carrier’s review; it is not a website-issued approval. Changing the product, truck, destination or route inputs clears it. Rankings require checked routes and complete prices.

Specifications: each product links to its published 2026 specification. Dongara limesand uses the corrected supplied 12.0% in the 0.075–0.15 mm fraction; the public PDF still shows 312.0. Bio-Lime sieve fractions total 100%; Boranup totals 99.9% due to rounding. Spec links checked 18 October 2026.

Published pit locations · Optima Lime specifications · Particle-size weighting method · Current heavy-vehicle travel impacts

Town suggestions include 1,700 WA towns and localities from the WA Health 2024 list, including Albany, Geraldton, Merredin, Lake King and Beacon. Town selection does not verify farm access.

INTERNATIONAL & AUSTRALIAN EVIDENCE

Particle size. Capacity.
Effectiveness over time.

Crushed limestone has decades of research behind it. Use the four selected products above to compare measured capacity with a literature-based limestone scenario.

CCE: total capacity

Bulk NV × 10 gives kg CaCO₃ equivalent per tonne. This measured capacity includes all particle sizes.

Ca: nutrient mass

Total Ca% × 10 gives kg calcium per tonne. It does not measure soluble calcium or establish a soil-pH increase.

pH: soil response

Particle size, source, moisture, placement, time and soil buffering determine the response. Product pH cannot be used as a soil-pH multiplier.

Start with the lead Australian study above → The numerical scenario below is a separate Brazilian benchmark. Its factors are not derived from Conyers, Scott & Whitten (2020).

Supporting calculation · two-year limestone benchmark

Pandolfo & Tedesco (1996), Brazilian field microplots: relative effectiveness averaged 100% below 0.30 mm, 68% at 0.30–0.84 mm and 31.5% at 0.84–2 mm over two years. These are study-specific pH-response factors, not universal percentages dissolved.

Calculation: fraction kg/t × fraction NV/100 × study effectiveness factor; then sum the assessed fractions. For 250–500 µm we show 68–100%; for 500–1,000 µm, 31.5–68%, because the product sieves cross the study boundaries. These are mapping bounds, not statistical confidence intervals.

Updates with your four product selections and application rates

Partial index: only fractions with size and NV data are assessed. Unmodelled mass is displayed, not assumed ineffective. The result is not whole-product effective CCE, a measured reacted mass, or a predicted soil-pH rise. Missing NV within the assessed bins makes the index unavailable. Fraction assays may not reconcile with bulk assays.

HiCal: this is a conventional limestone scenario applied to its published fraction assays. No additional benefit is assigned to proprietary treatment technology. It is not a validated HiCal performance prediction. The same literature transfer limitations apply to the other sources.

Show the fraction-by-fraction calculations

Financial interpretation: cost per index tonne allocates the entire application cost to the assessed index. Compare coverage before comparing costs. Crop ROI still requires a yield or gross-margin response. A soil-pH estimate requires a matching soil lime-response curve.

06 / TAKE IT TO THE PADDOCK

Keep the evidence
with the plan.

Sample by depth before treatment and repeat at the same depths after treatment. Record application date, rate, moisture conditions and actual incorporation.

OPTIMA LIME

Build the program around your soil profile.

Supply: Wanneroo / Wesco Road, Nowergup. Confirm collection details when ordering.

Discuss your application ↗