CALCIUM DELIVERY
MacroPrima
62 g/L calcium. Explore how rate and treated soil mass change potential calcium occupancy of your measured CEC.
Explore calcium & potassium ↓
WILCHEM ROWLOADER CALCULATOR
PRECISION IN THE TREATED ZONE
See what your liquid rate delivers where it is placed. Connect soil analysis, row spacing and treatment volume to potential calcium and potassium occupancy changes—then explore water-driven dilution and Adsorb’s potential added exchange capacity.
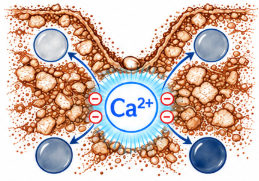
MacroPrima calcium illustration.
One part of your Rowloader program.
THREE PRODUCTS · ONE SOIL-ZONE VIEW
CALCIUM DELIVERY
62 g/L calcium. Explore how rate and treated soil mass change potential calcium occupancy of your measured CEC.
Explore calcium & potassium ↓POTASSIUM DELIVERY
270 g/L potassium. Compare K alone or alongside MacroPrima, with independent rates in the same selected zone.
Compare your liquid program ↓POTENTIAL EXCHANGE CAPACITY
Explore potential additional exchange capacity using measured product charge, alongside the UAN retention scenario.
Explore Adsorb & UAN ↓What “localised CEC change” means here: MacroPrima and K27N add cations to the selected soil mass; the calculator holds CEC capacity fixed and shows potential occupancy changes. Adsorb’s added-capacity scenario requires measured exchange-charge input. These scenarios do not establish removal of Al or Na, a pH response, or a measured field outcome.
WORLD & AUSTRALIAN SOILS / REGIONAL PLANNING
Explore global WRB groups by world region and country, or Australian soil orders by state and shire. Review the source and depth before loading regional properties or an illustrative chemistry scenario.
These are constructed examples, not laboratory samples, national means, recommended cation targets or measured product responses. Each cation profile totals 100% of its assumed CEC including exchangeable H. CEC is held fixed; product additions change potential occupancy or the calculated mix, not the soil’s exchange capacity itself. Actual values vary with horizon, clay mineralogy, organic matter, pH and laboratory method.
Soil-order names follow Australian Soil Classification, including Arenosols. The broad low-to-high CEC contrast is informed by the DPIRD / UWA / GRDC Soil Quality resource and NSW DPIRD CEC guidance. These references do not provide or validate the specific preset samples.
Loading a scenario replaces the current calculator’s soil values and selects Both products. It retains product rates and placement dimensions. Uploaded reports remain available to select again. Bulk density and gravel are explicit scenario assumptions; texture does not set a national average.
START HERE / YOUR SOIL RESULTS
Import a CSBP-style or Radicle/Microbika text PDF, or a CSV with sample IDs and labelled soil results. Review the extracted values and select a sample. Your selection updates the Wilchem Rowloader Calculator immediately.
Files are read in your browser and are not uploaded to a server. Text PDFs: up to 10 files, 25 MB each. Scans require OCR. Missing and below-detection results remain blank.
Start with your soil analysis, or enter a sample manually.
No report imported.
Use exchangeable cations from the same sample and soil layer. ppm and cmol(+)/kg are converted where units are explicit; % requires laboratory CEC. Sample depth describes the analysis layer and does not overwrite your treatment-zone dimensions. Gravel weight % is not treated as volume %.
Manual soil inputs
SOIL & PLACEMENT CALCULATOR
Set the dimensions actually wetted or treated, then enter exchangeable soil cations and CEC. Compare calcium supply with a target you choose.
Preset: confirmed 7 L/ha; assumed 25.4 cm rows, 5 × 5 cm continuous band, 0% gravel and manual 1.4 g/cm³ bulk density (texture unconfirmed). Uses current 62 g/L calcium basis; trial formulation unconfirmed. Enter the trial’s measured CEC and cations separately.
Width × along-row length × vertical height defines a rectangular zone. Height is treated thickness, not burial depth. For continuous bands, total row length is calculated from row spacing. Individual zones must not overlap.
Gravel is a volume percentage, not a laboratory weight percentage. Calculations use the fine-earth fraction (<2 mm); coarse fragments are assumed to contribute no exchange capacity. USDA-NRCS Table G-13 reference ranges ↗
Switching between % and ppm converts entered values when a valid CEC is supplied. Without CEC, switching units clears the entries to avoid interpreting them in the wrong units.
Use exchangeable cations and a compatible CEC method from the same sample and treated soil layer. Total-element or unrelated extractable ppm values cannot be substituted. Missing cations stay blank.
TREATED SOIL PER HECTARE
TARGET-BASED NUTRIENT SCENARIO
Enter CEC and calciumTheoretical MacroPrima equivalent at 62 g/L Ca, assuming all added calcium becomes exchangeable within the defined soil mass and CEC remains fixed. This is not a validated agronomic rate or a predicted sodium/aluminium removal.
BEFORE & AFTER / CALCULATED CATION MIX
ADJUST APPLICATION RATES
Linked to the rate above: change either control and both update. The target-based calculated rate stays separate.
Adjust K27N independently. The slider and number field stay in sync.
LIVE BEFORE & AFTER
Five-cation mix shares — not % of full CEC. Use the potential CEC occupancy values above for the granular comparison.
Values below show each ion’s share of the five-cation mix. Al, Na, Mg and K amounts remain unchanged in this model; their percentages fall as calcium is added.
Before share = each cation’s cmol(+)/kg ÷ total Ca + Mg + K + Na + Al cmol(+)/kg × 100. Added Ca cmol(+)/kg = added Ca mg/kg ÷ 200. After share uses the new calcium amount and recalculates the five-cation total.
Only supplied calcium is added in this scenario. Magnesium, potassium, sodium and aluminium quantities stay constant, so a lower percentage means a smaller relative share, not removal or leaching. This is a mixing illustration, not an equilibrium exchange model, predicted base saturation or measured field result. It excludes other product cations because the current confirmed calculation basis is 62 g/L calcium.
Enter all five cations above as % of CEC or exchangeable ppm. The calculator converts them to charge equivalents, adds the calcium supplied by your assessed MacroPrima rate in the selected soil volume, then calculates each cation’s share of the five-cation mixture.
These graph percentages add to 100% across Ca + Mg + K + Na + Al. Hydrogen is excluded from this mixing graph. They are not % of the full CEC when other exchangeable ions are present. Your laboratory-based saturation percentages remain in the soil table below.
SAME ROOT ZONE / THREE COMPARISONS
Compare calcium supply and acid neutralisation in the soil volume selected above. All application quantities are per paddock hectare, placed within that zone.
Starting values are editable examples, not Coorow measurements: 36% Ca, 90% neutralising value, 50 L/ha UAN at 0.42 kg N/L, all entering the zone. The 1.8 acidification factor is a conventional cropped-soil estimate; actual net acidity varies with nitrogen uptake and losses.
Ask the laboratory for the pure-CaCO₃ requirement per tonne of your sampled soil to reach the target pH. Do not enter a whole-paddock t/ha rate in that field.
LIVE ROOT-ZONE COMPARISON
Calcium equivalence does not establish equal pH change, speed of reaction or field performance.
Calcium-match limesand = MacroPrima litres × 0.062 kg Ca/L ÷ limesand Ca fraction. Target-calcium limesand uses the calcium gap from your CEC scenario. Both assume complete availability of the limesand calcium.
UAN acid equivalent = UAN L/ha × kg N/L × fraction entering the zone × acidification factor. Limesand to offset this acidity = acid equivalent ÷ neutralising-value fraction. Acid loading = acid equivalent × 1,000,000 ÷ treated soil kg. This is potential net acid loading, not an immediate pH drop.
pH-correction limesand = laboratory requirement (kg CaCO₃/t soil) × treated soil tonnes ÷ neutralising-value fraction. Added UAN maintenance demand is shown separately; add it only if it is not already included in the laboratory/program requirement. These are eventual chemical equivalents: particle size, incorporation, moisture and reaction time affect actual limesand performance. No spreading or delivery efficiency is assumed.
MacroPrima’s 62 g/L calcium analysis does not establish its acid-neutralising capacity. No UAN neutralisation or pH increase is credited to MacroPrima without a measured neutralising value. CEC and soil texture alone cannot predict a pH response or aluminium reduction.
References: Kissel et al. (2020), Table 3: UAN acidity; DPIRD: agricultural lime quality; University of Minnesota: soil pH and lime requirement.
SAME RATE / DIFFERENT CONTACT VOLUME
Compare continuous bands at the same row spacing, rate and bulk density. Smaller assumed contact volumes give higher local concentrations; these are scenarios, not measured wetting patterns.
Potential calcium saturation addition for your selected zone at three illustrative CEC values. These are not measured Coorow soils or fixed texture classifications.
Assumes all supplied Ca becomes exchangeable and CEC stays fixed. This shows added calcium charge relative to exchange capacity, not a prediction of which ions leave the soil.
| Cation | ppm (mg/kg) | cmol(+)/kg | % of CEC |
|---|
Estimated ECEC = Ca ppm/200 + Mg ppm/120 + K ppm/390 + Na ppm/230 + Al ppm/90 + exchangeable H in cmol(+)/kg (if supplied). All five ppm entries are required; enter 0 only for a confirmed zero. Without H, the result is labelled a five-cation estimate excluding hydrogen. Other exchangeable ions, such as Mn, are also omitted. This is not buffered laboratory CEC. Use exchangeable results from compatible methods, not saturated-extract or total-element ppm. Australian Soil Quality ECEC method ↗
Continuous row length = 10,000 ÷ row spacing (m). Volume = row length × band width (m) × height (m). Individual-zone volume = width × along-row length × height × number of zones/ha. Fine-earth mass (kg/ha) = total zone volume (m³/ha) × fine-earth bulk density (g/cm³) × 1,000 × (1 − gravel volume %/100). Gravel-adjusted fine-earth density is fine-earth mass per whole-soil volume, not the total bulk density including stones. Default BD is the midpoint of the USDA-NRCS Table G-13 moist-volume bulk-density range, used as a planning proxy for dry fine-earth mass. It is an international reference, not a global mean; measured BD is preferred. CEC and ppm must refer to the fine-earth fraction. CEC capacity remains fixed; calcium addition changes its potential occupancy.
Exchangeable cmol(+)/kg = ppm ÷ factor: calcium 200, magnesium 120, potassium 390, sodium 230, aluminium 90. Saturation (%) = exchangeable cation ÷ CEC × 100. Required calcium (kg/ha) = positive calcium saturation gap ÷ 100 × CEC × 200 × soil mass ÷ 1,000,000. Product equivalent (L/ha) = required calcium ÷ 0.062. These conventional conversion factors are rounded.
A target saturation is a user-defined scenario, not an ideal ratio recommended by this site. Soil type, pH, drainage, buffering, water chemistry and field calibration still determine the practical program. The supplied trials do not establish a universal CEC-by-texture rate equation. The cation model does not calculate acidity neutralisation, sodium leaching or aluminium reduction. The separate limesand/UAN comparison uses its own stated inputs.
References: NSW soil-test interpretation; University of Minnesota: limits of base-saturation ratios.
CEC COMPOSITION / CONDITIONAL pH SCENARIO
Explore calcium replacing exchangeable Al and H while that acidity is neutralised. Uses your applied rate, CEC and gravel-adjusted soil mass. Sodium replacement alone is not counted as acidity neutralisation.
Buffering must apply to this soil and the same pH method. Use a measured buffer slope or a laboratory lime requirement divided by its tested pH change, on a fine-earth tonne basis. The UAN mixture titration curve and 62 g/L Ca analysis do not supply these two inputs.
100% is an idealised upper allocation, not measured efficiency. The calculation is capped by added Ca charge, available Al + H charge and the entered neutralising capacity. Enter H in the cation inputs above; it is not inferred from the unfilled CEC balance.
Neutralised charge = minimum of added calcium charge × allocation, entered Al + H charge, and product neutralising capacity per kg soil. One cmol(+) acidity/kg corresponds to 0.5 kg CaCO₃ equivalent/t soil. Potential ΔpH = neutralised charge × 0.5 ÷ soil buffering capacity.
Al and H are reduced proportionally and the same charge is assigned to Ca; Mg, K and Na are held unchanged. This is a separate, fixed-CEC exchange scenario. The five-cation mixing graph above is not used as evidence that acidity has been removed. Only the exchange-linked component is shown; excess neutralisation and reserve acidity are not modelled.
The constant-buffer approximation is limited to a rise of 0.5 pH units and an endpoint no higher than 7.0. It excludes ongoing UAN acidification, moisture constraints, reaction time and field variability. No automatic buffering value is assigned from texture or CEC.
DPIRD iLime: alkalinity and soil buffering basis ↗This scenario is not the iLime model or a calibrated MacroPrima response model.
POTENTIAL ROOT-ZONE pH
02 / THE EVIDENCE
Field trials, soil observations and laboratory measurements from the supplied Wilchem documents and master worksheet.
LATEST FIELD EVIDENCE / COOROW 2025
Wheat paddock-scale demonstration, MacroPrima with UAN at seeding. Rate confirmed by Johan Potgieter; other application and soil details are not supplied in the report.
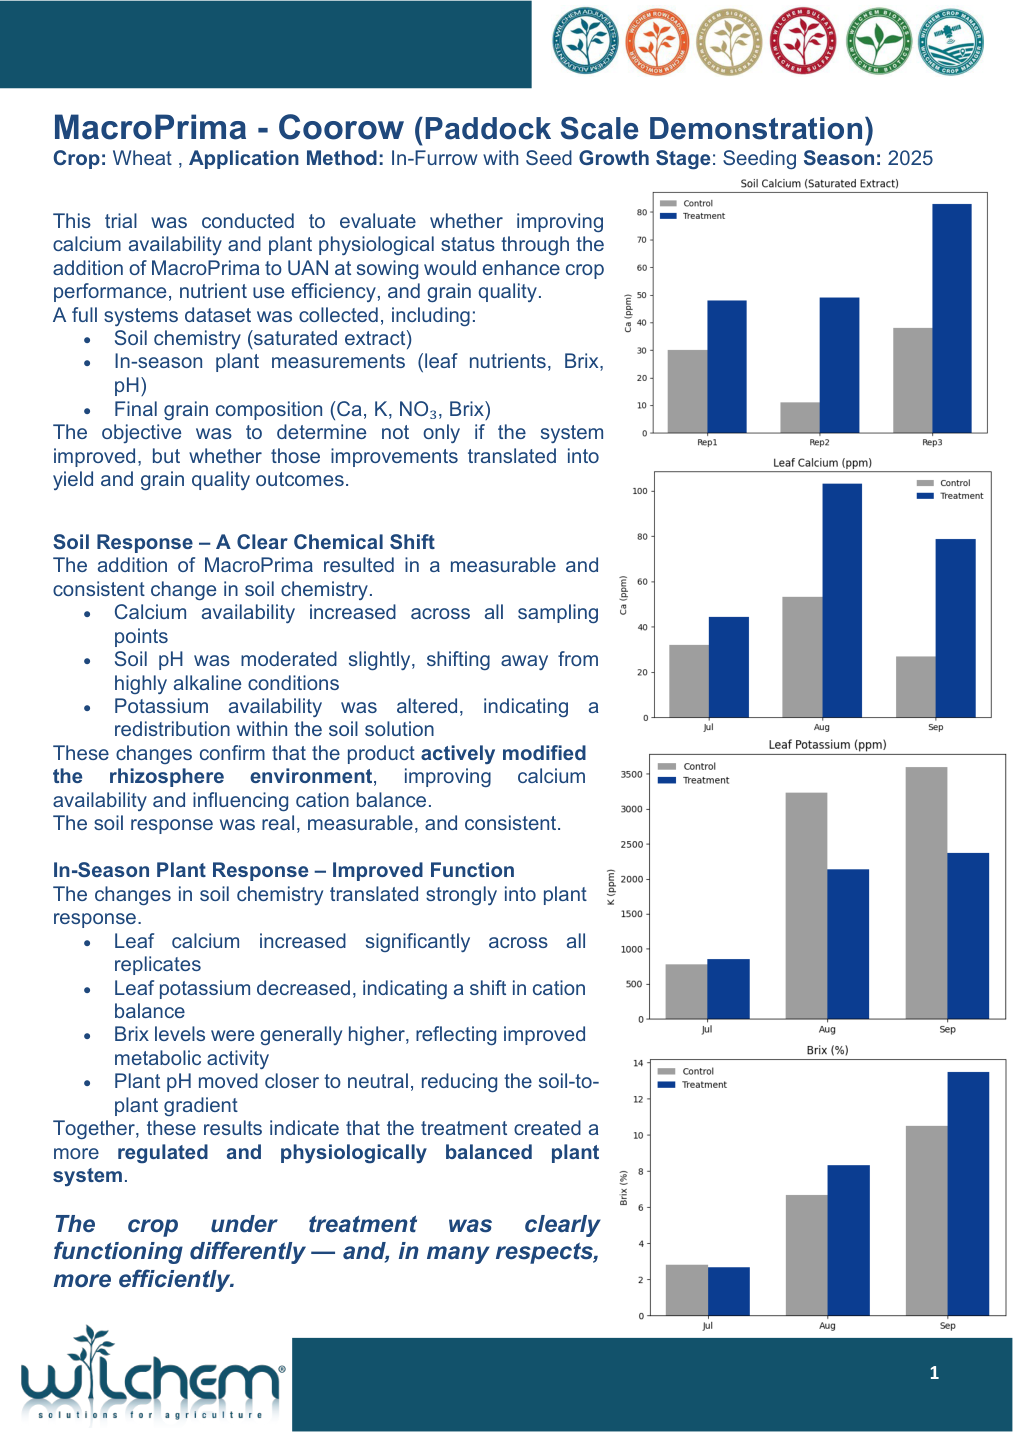
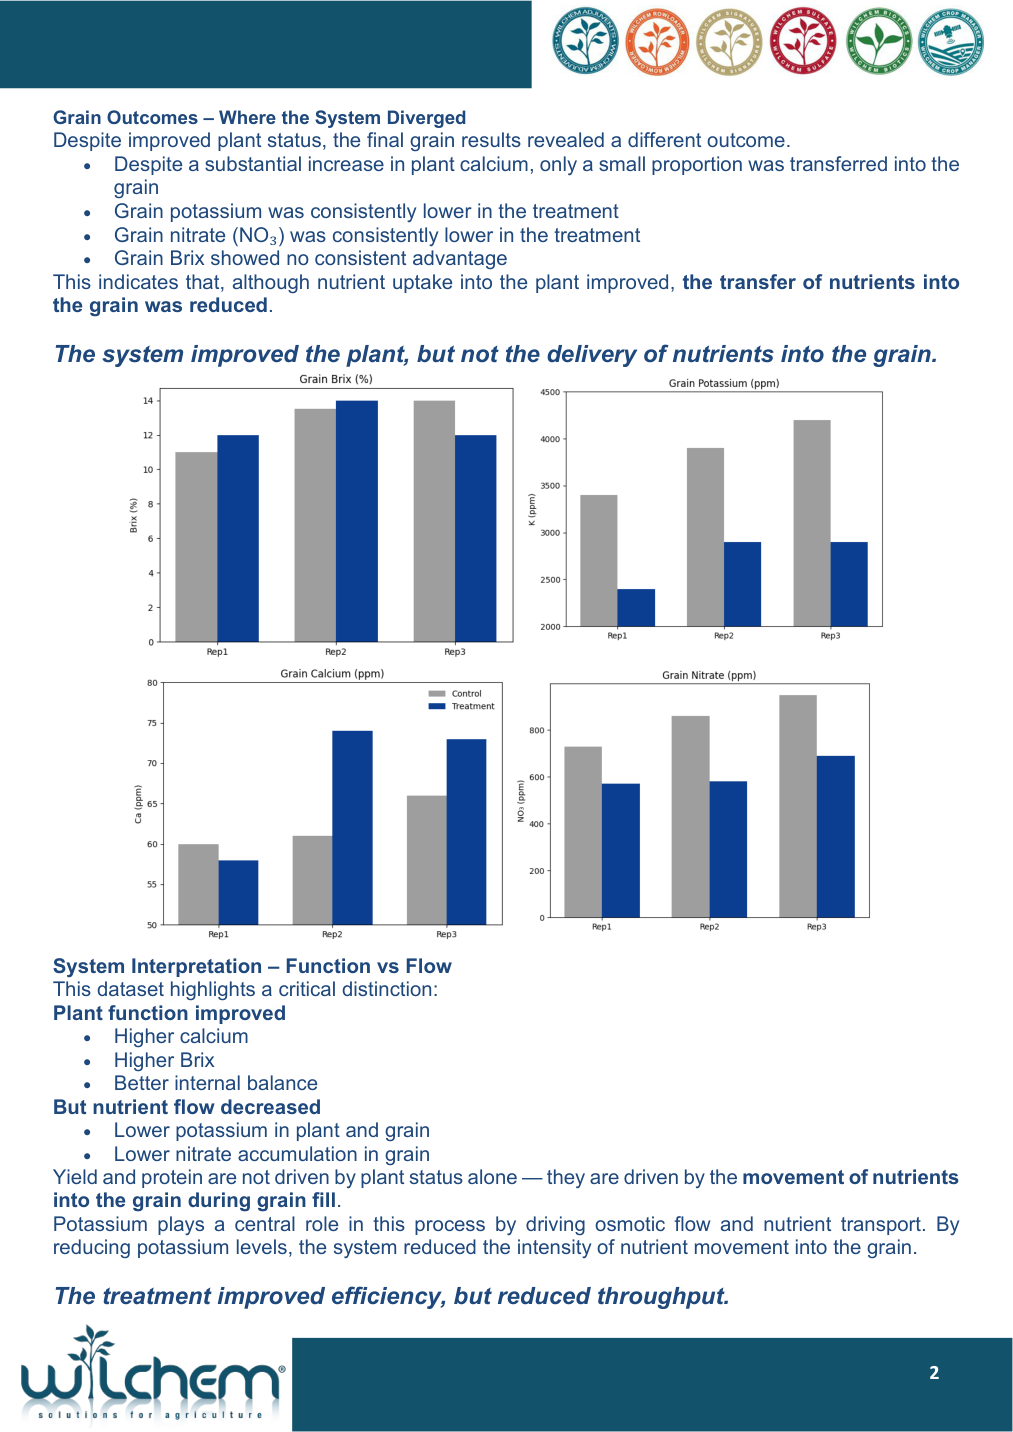
Saturated-extract soil calcium was higher in all three comparisons. Leaf calcium increased at all three sampling dates. Leaf potassium was lower in August and September, but slightly higher in July.
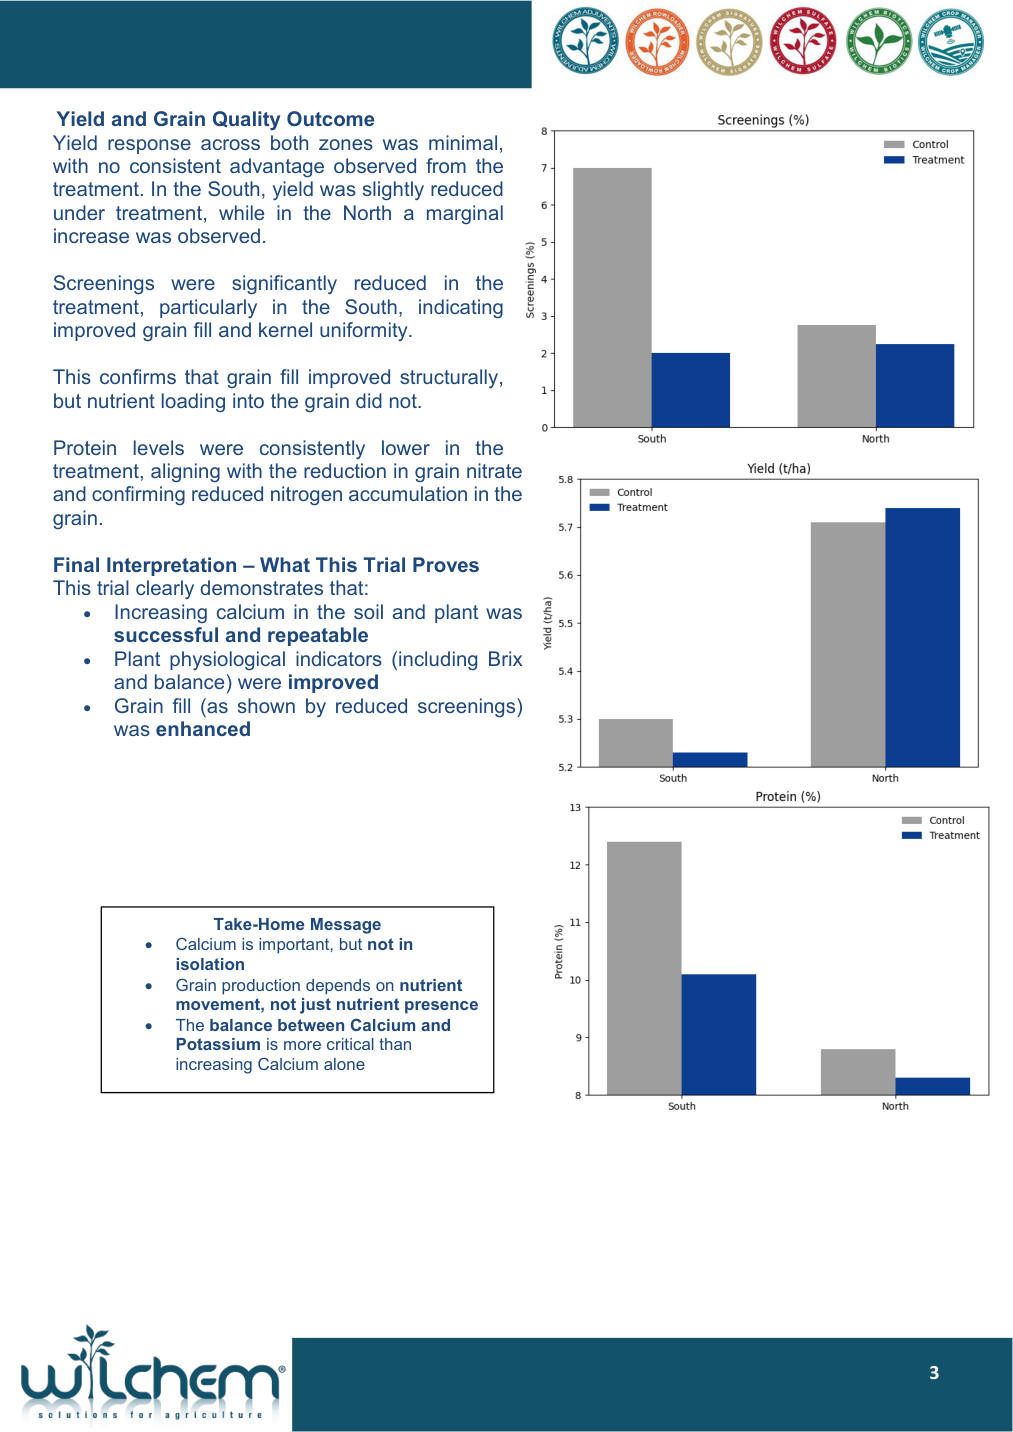
Screenings were lower, particularly in the South. Yield was slightly lower in the South and slightly higher in the North. Protein and grain nitrate were lower in both zones / all reported comparisons respectively.
The results show a soil-solution and plant response. Saturated-extract calcium is not exchangeable calcium or base saturation. The report does not provide the CEC measurements or statistical outputs needed to calibrate a displacement or dose-response model.
The supplied report contains interpretations about nutrient transport. These remain proposed explanations; concentrations alone do not measure nutrient flow. Some chart axes begin above zero. Read the labelled scales when comparing bars.
Source: Wilchem MacroPrima Results 2025 Coorow, pp. 1–3. Application rate supplied separately by the trial owner. The 25.4 cm modelling spacing comes from a different Coorow wheat trial (2020), not a district average or a confirmed 2025 measurement. Row-spacing reference ↗
Explore the Coorow placement scenario ↑The trial bulletin includes root-zone pH, yield charts and a three-season summary. It reports 42 replicated trials, but does not supply plot-level data for that claim.
Read trial bulletin ↗The bulletin compares 50 and 100 L/ha MacroPrima with a control and 1 t/ha gypsum after seven weeks. These are historical trial rates, not calculator defaults.
Read infiltration study ↗The brochure shows sap nitrogen, phosphorus and potassium responses. The worksheet also contains paddock observations; these are not all controlled comparisons.
Read product brochure ↗CALCIUM EXCHANGE / TWO SOIL CONSTRAINTS
Calcium can replace other cations on negatively charged soil surfaces. What happens to the displaced ion determines the next management step.
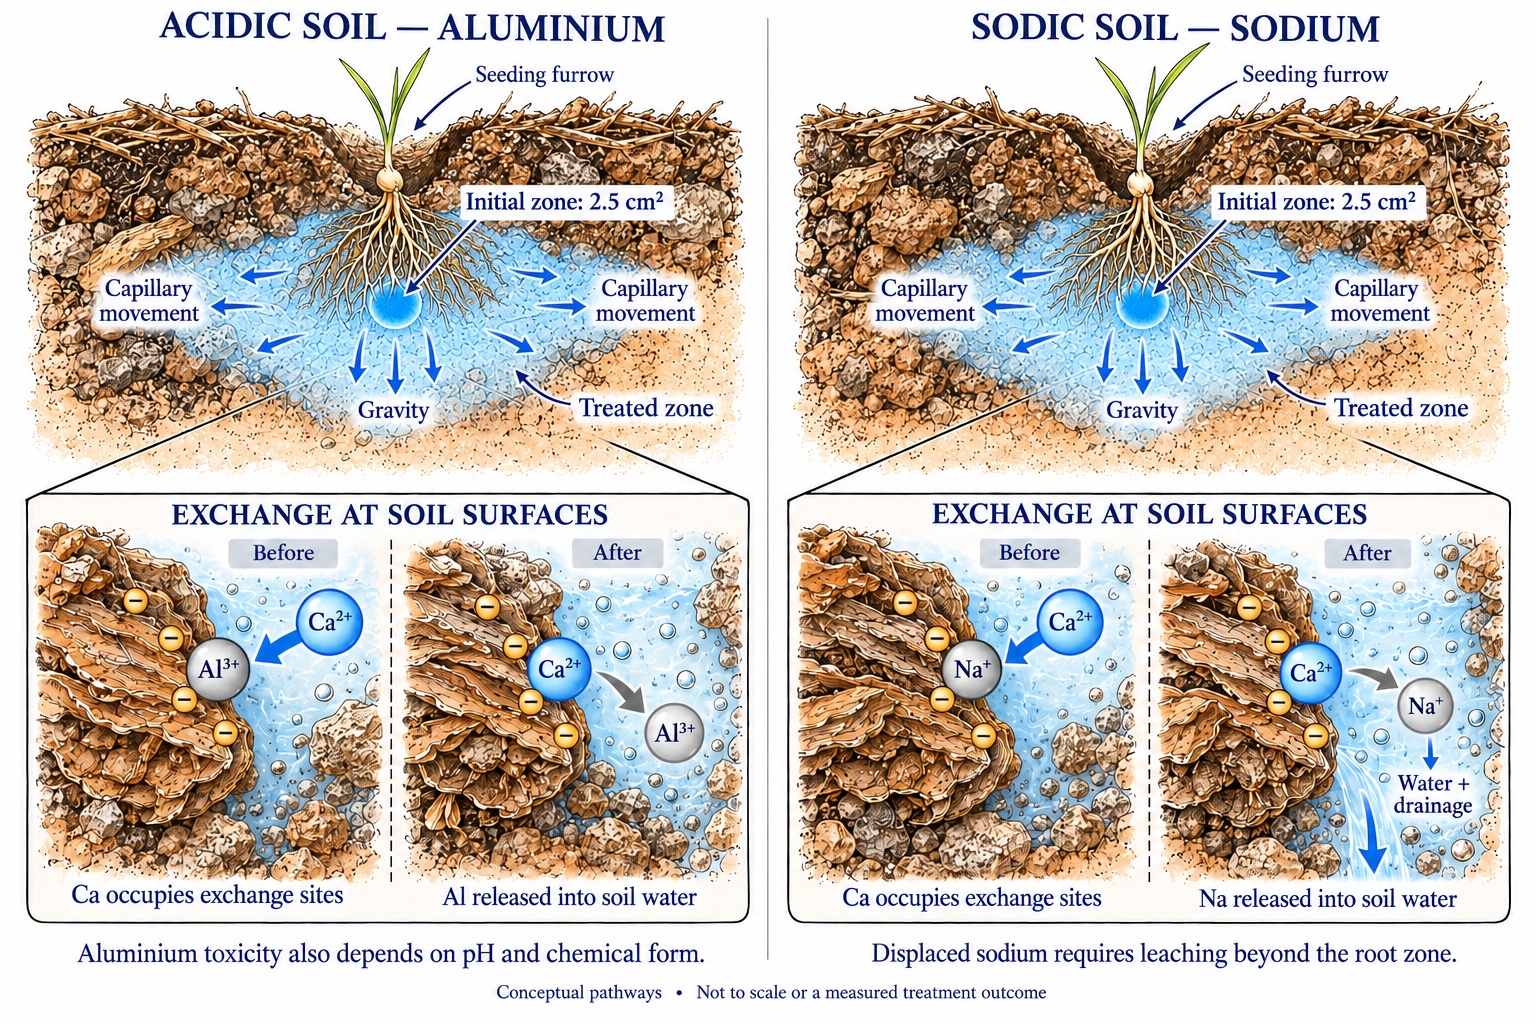
Adding calcium can release exchangeable aluminium into soil solution. That does not automatically reduce aluminium toxicity and can increase soluble Al. Acidity correction and aluminium speciation must also be assessed; adequate alkalinity can promote less-soluble Al forms, while suitable ligands can change its chemical form. Calcium concentration alone cannot predict detoxification.
Calcium can replace exchangeable sodium and support clay flocculation. Displaced sodium remains in solution until suitable water movement and drainage carry it beyond the root zone. Assess ESP, salinity, water quality and drainage as part of the amendment program.
Conceptual illustration of general soil chemistry; not measured MacroPrima outcomes or a prediction that all ions are displaced. Exchange is reversible. Actual responses depend on dose, contact volume, mineralogy, pH and soil-solution chemistry. The calculator's five-cation graph remains a mixing illustration, not a selective displacement model.
Mechanism references: Anderson et al. (2021), soil solution chemistry (lime/gypsum research); WA gypsum recommendations.
Download technical sheet + sketches ↓APPLICATION EQUIPMENT / FURROW MSA
Plan the placement of liquid calcium with your seeding system.

Broadacre in-furrow: 4–8 L/ha. Target the planned root-zone band.
Deep placement: 20–40 L/ha. Place into the identified soil constraint.
Furrow’s Friction Flow liquid kits include rate control, manifolds and tubing. Confirm equipment suitability, dilution and placement for MacroPrima with your adviser.
Technical sheet with application partner page ↓03 / HOW IT WORKS
Liquid calcium with organic carbon, developed for the zone where fertiliser and roots meet.
Supplies calcium to increase calcium saturation of the soil’s cation exchange capacity (CEC), supporting displacement of exchangeable aluminium in acidic soils and sodium in sodic soils.
Download updated technical sheet ↗Previous editable technical sheet (19 Oct, PowerPoint) ↓The alkaline formulation is intended to manage localised acidity associated with ammonium fertiliser in the furrow. The supplied guidance describes MacroPrima as part of a wider pH program, not a replacement for lime needed to treat existing acidity.
Calcium can exchange with other cations on soil surfaces. Displaced sodium still needs suitable water movement and drainage to leave the root zone. The response depends on soil and water chemistry.
Use soil pH, exchangeable cations, aluminium, salinity and drainage together when assessing a program. Aluminium behaviour depends on pH as well as ion exchange; calcium content alone does not predict its removal.
04 / MIXING INFORMATION
A searchable summary of the supplied 2025 compatibility guide. Check current input labels and jar-test proposed mixtures; a physical jar test does not establish pesticide efficacy.
05 / SOURCE LIBRARY
Seven supplied documents and all 25 worksheet tabs. Historical references are presented as MacroPrima throughout the site's text and data.
Source values are retained with their Excel row and column references. Blank cells remain blank. These historical records include observations, recommendations and laboratory work; they are not all efficacy trials. Units and protocols are only as complete as the supplied worksheet.
Embedded worksheet images are not included in this cell-data archive. Related trial charts are available in the document library above.
The calculator uses the latest project label instructions: calcium 62 g/L. The historical brochure lists calcium 65 g/L and a different nutrient analysis. Historical results and mixtures should not be taken as validation of the revised formulation or as universal application recommendations.
WILCHEM AGRICULTURE